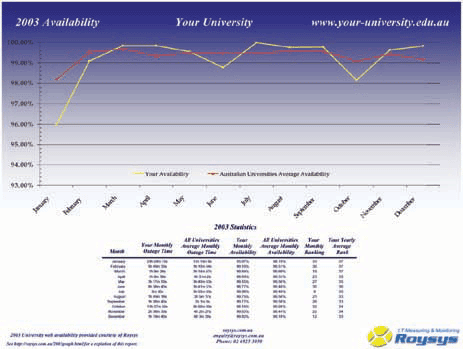
The 2003 University Web Availability graph provides details on the availability of each Australian University public web site and the average of all 38 Australian universities.

2003 Availability Graph

The graph plots the monthly availability for each university for 2003. The Availability is a measurement of the total available time for the university's public web service for each month. See the Roysys Benchmark Report for more details on how availability is measured.

Also included in the graph is the average availability for all 38 Australian Universities.

2003 Statistics

The statistics provide a monthly breakdown of availability figures throughout 2003.

  • Your Monthly Outage Time: Details the total outage time for a university during the month.

  • All Universities Average Monthly Outage Time: Details the average total outage time for all 38 Australian universities for each month.

  • Your Monthly Availability: The percentage of the total time your web service is available over the total time in the month.

  • All Universities Average Monthly Availability: The percentage of the average total time all Australian universities public web service was available over the total time in the month.

  • Your Monthly Ranking: Displays a universities availability compared to the 37 other Australian universities. A rank of 1 is the best performing university for the month.

  • Your Yearly Average Rank: All universities are ranked on their availability over the previous 12 months. This statistic displays a universities ranking for the previous 12 months compared to the other 37 Australian Universities.


Order a Graph

If you would like additional complimentary copies of the graph for your university, just email Roysys providing your name and contact details.